
This is the concluding article in our three-part series on Thanos monitoring.
- Part 1: “Thanos: Long-Term Storage of Prometheus Metrics”
- Part 2: “Deploying Thanos and Prometheus on a K8s Cluster”
- Part 3: “Thanos: Aggregating Multiple Prometheus Instances”
In the previous article, we ended by configuring the Thanos Query as a datasource in Grafana to query multiple Prometheus instances from a single datasource.
Now, let’s explore how Thanos aggregates multiple Prometheus instances. We will discuss two relevant cases: within a single Kubernetes cluster and across multiple Kubernetes clusters.
Thanos and Multiple Prometheus Instances in a Single K8s Cluster
Case Introduction
Let’s consider a kubernetes cluster with several namespaces, used by different teams. Each team has its own Prometheus collecting their metrics, and there’s a system Prometheus collecting the cluster’s metrics.
The goal is to have all our metrics accessible on Grafana, regardless of which Prometheus has the metric. Let’s see how to configure our Prometheis (did you know, the plural of Prometheus is Prometheis) and Thanos to achieve this. For simplicity in this article, we will not set up long-term metric storage with Thanos but only the global view.
Deploying the Prometheis with the Thanos sidecar
For the system Prometheus, we’ll simply use the kube-prometheus-stack. We configure Prometheus to target only PodMonitor and ServiceMonitor with a prometheus label. This way, we distinguish what should be monitored by the system Prometheus and what should be monitored by other instances.
prometheus:
  prometheusSpec:
    serviceMonitorSelector:
      matchExpressions:
        - key: prometheus
          operator: DoesNotExist
    podMonitorSelector:
      matchExpressions:
        - key: prometheus
          operator: DoesNotExist
    thanos:
      version: 0.31.0
For each team, we’ll set up a dedicated Prometheus instance that targets only PodMonitor and ServiceMonitor that have a prometheus label with the team’s name:
apiVersion: monitoring.coreos.com/v1
kind: Prometheus
metadata:
  name: team1
  namespace: monitoring
spec:
  serviceMonitorSelector:
    matchLabels:
      prometheus: team1
  podMonitorSelector:
    matchLabels:
      prometheus: team1
  thanos:
    version: 0.31.0
  serviceAccountName: kube-prometheus-stack-prometheus
As a test, let’s add a PodMonitor that fetches metrics from Prometheus:
apiVersion: monitoring.coreos.com/v1
kind: PodMonitor
metadata:
  labels:
    prometheus: team1
  name: prom-team1
  namespace: monitoring
spec:
  jobLabel: app.kubernetes.io/name
  podMetricsEndpoints:
    - path: /metrics
      port: web
  selector:
    matchLabels:
      operator.prometheus.io/name: team1
Configuring Thanos Query to Target the Sidecars
We’ll deploy Thanos using the bitnami/thanos chart, as discussed in the previous post. Our Prometheus instances are deployed by the operator, so they are reachable through the automatically added prometheus-operated service. We can use Thanos’ DNS Service Discovery to target all our Prometheus at once with the following values:
query:
  dnsDiscovery:
    sidecarsService: "prometheus-operated"
    sidecarsNamespace: "monitoring"
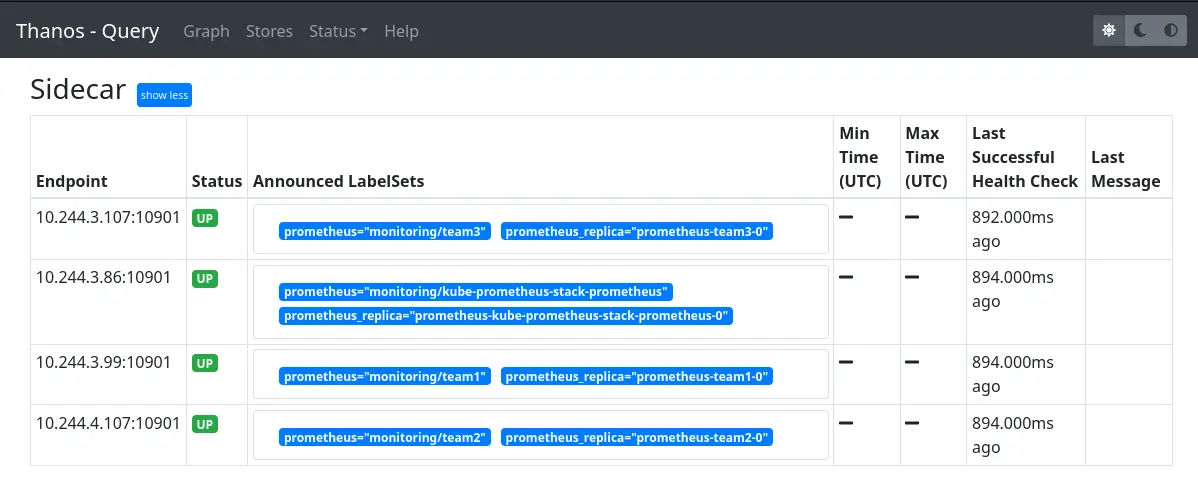
Checking the Results on the WebUI
When accessing the Thanos Query interface, under the “Stores” tab, we can see our different Thanos sidecars:
And we can test a query to ensure all Prometheis are queried:
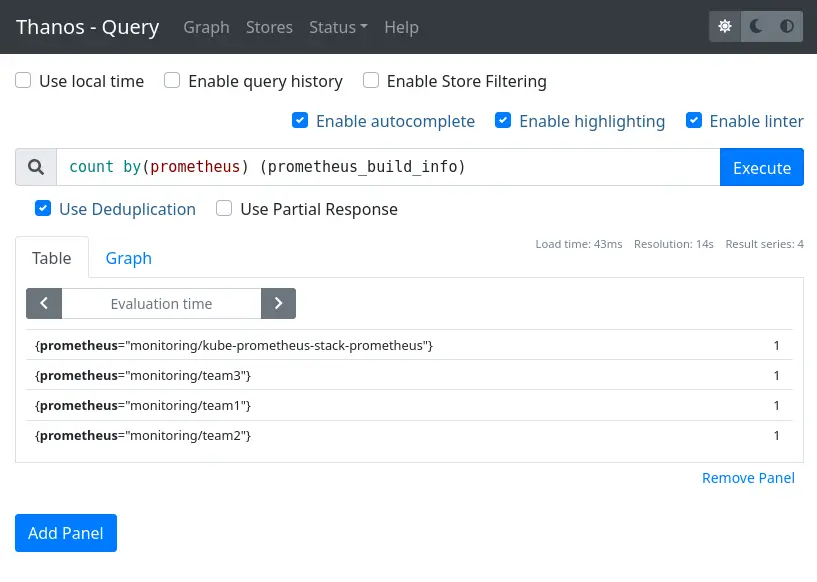
All that’s left is to add the Thanos Query as a Prometheus type datasource in Grafana for use.
Thanos and Multiple K8s Clusters Monitored by Prometheus
Case Introduction
Now, instead of wanting a global view of Prometheus within a single cluster, we aim to target multiple Kubernetes clusters. Our Thanos Query should be able to reach the Thanos StoreAPI of other clusters. The StoreAPI is exposed in gRPC, which uses HTTP/2. So, we can use an Ingress for simplicity. In our example, we’ll use ingress-nginx as the ingress controller.
Deploying Prometheus and the Thanos Sidecar Exposed via an Ingress
We install Prometheus with the kube-prometheus-stack chart with the following values:
prometheus:
  prometheusSpec:
    externalLabels:
      cluster: cluster-b
    thanos:
      version: 0.31.0
  thanosIngress:
    enabled: true
    ingressClassName: nginx
    annotations:
      nginx.ingress.kubernetes.io/backend-protocol: "GRPC"
      cert-manager.io/cluster-issuer: letsencrypt
    hosts:
      - thanos-grpc.cluster-b.example.com
    pathType: Prefix
    tls:
      - secretName: thanos-sidecar-tls


        hosts:
          - thanos-grpc.cluster-b.example.com
Here are two key takeaways:
- We set an external label with the cluster name, this allows us to use the Grafana Kubernetes dashboards in multi-cluster mode
- We use the annotation
nginx.ingress.kubernetes.io/backend-protocolinGRPCmode so that ingress-nginx speaks in gRPC to the service
Configure Thanos Query to retrieve metrics from all clusters
We deploy Thanos with the following values to tell it to join the two sidecars exposed via an ingress in HTTPS:
query:
  stores:
    - 'thanos-grpc.cluster-b.example.com:443'
    - 'thanos-grpc.cluster-c.example.com:443'
  extraFlags:
      - --grpc-client-tls-secure
queryFrontend:
  enabled: false
When we look at the Thanos Query web interface, we clearly see our two sidecars:
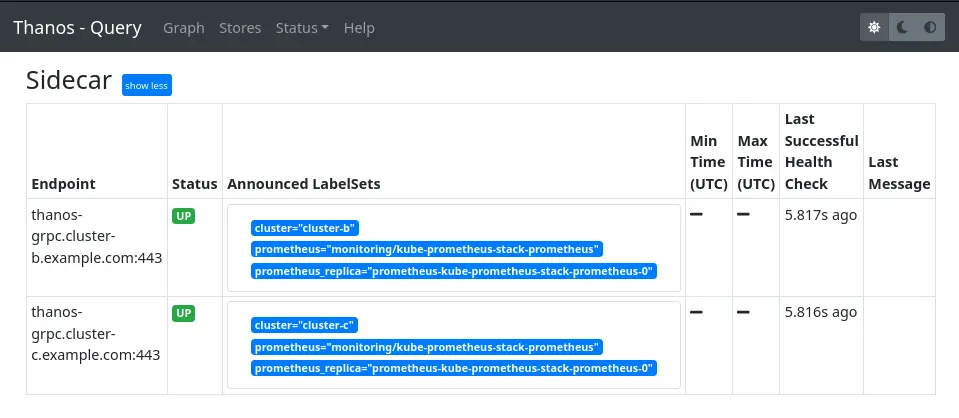
Additionally, we aim to integrate the sidecars from our initial cluster. The problem is that we use the --grpc-client-tls-secure option and our first sidecars do not use TLS, so it won’t work. There is an open issue about this. While waiting for it to be implemented, we can use the Thanos Query we just created as an intermediary and add it to the configuration of the Thanos Query we had previously set up:
query:
  dnsDiscovery:
    sidecarsService: "prometheus-operated"
    sidecarsNamespace: "monitoring"
  stores:
    - 'dnssrv+_grpc._tcp.thanos-external-query-grpc.monitoring.svc.cluster.local'
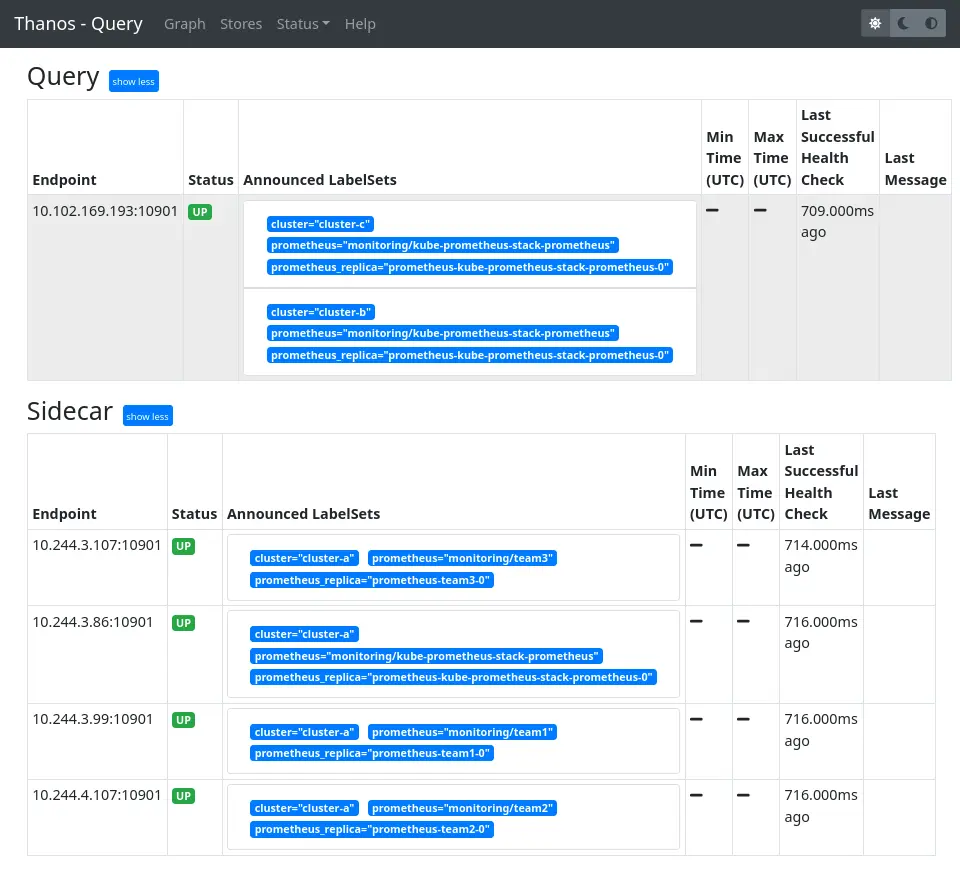
The Thanos Query also exposes the StoreAPI, allowing us to target it in the same way we target a sidecar or a storegateway. We continue to use the DNS Service Discovery to point to the service of our other Thanos Query instance.
We add an external label cluster to the Prometheis deployed in the first part as we just did for the new clusters. Now, on the Thanos Query interface, we clearly see all our instances:
Configure multi-cluster Kubernetes dashboards and check the result on Grafana
The final step involves configuring the Kubernetes dashboards deployed by the kube-prometheus-stack chart to be multi-cluster with the following values:
grafana:
  enabled: true
  sidecar:
    dashboards:
      multicluster:
        global:
          enabled: true
        etcd:
          enabled: true
We redeploy the chart and then add Thanos as a Grafana datasource:
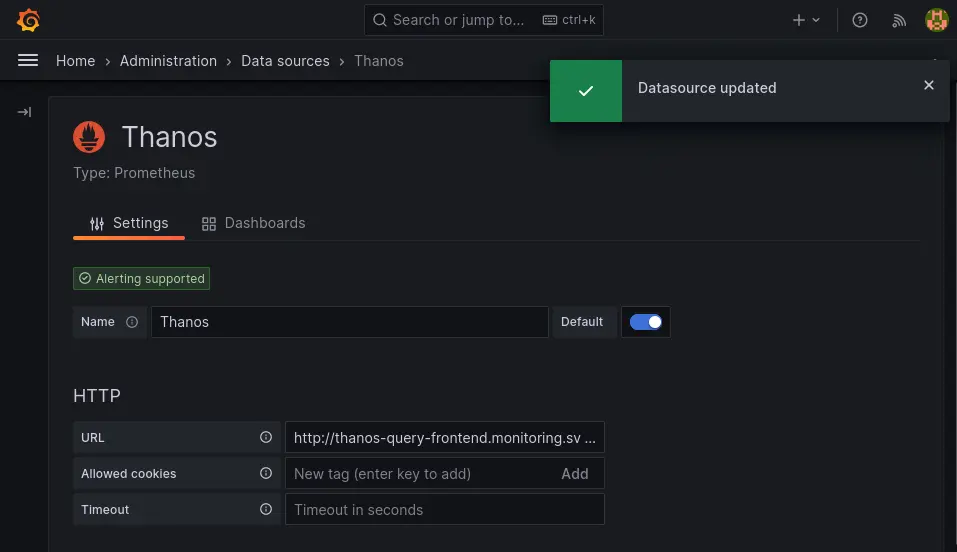
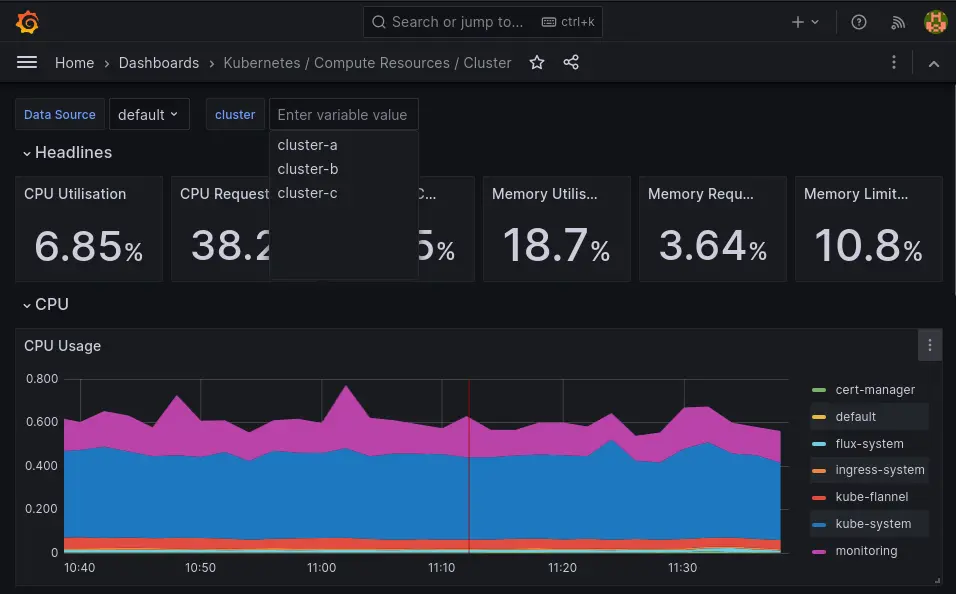
Now we can explore the Kubernetes dashboards that have a cluster filter, allowing us to visualize the metrics of all our instances from the same datasource.
With that, we wrap up our in-depth exploration of Thanos in this trilogy. See you soon for more monitoring topics!
Do not miss our latest DevOps and Cloud Native blogposts! Follow Enix on Linkedin!