
This article is the second in a series of 3 on Thanos monitoring.
- Part 1: “Thanos: Long-term Storage for Prometheus Metrics”
- Part 2: “Deploying Thanos and Prometheus on a K8s Cluster”
- Part 3: “Thanos: Aggregating Multiple Prometheus”
Today, it’s time for action: we heat up our Kubernetes cluster and focus on how to deploy Thanos.
Note: Our focus here is on deploying a single Prometheus and Thanos instance on Kubernetes, but Thanos can also be used and deployed outside of Kubernetes.
Deploying Thanos on K8s
We need an object storage for Thanos to store metrics. In this article, we use S3-type storage with a MinIO instance in the K8s cluster.
In real life, utilizing the object storage offered by our cloud provider is equally pertinent.
# We install MinIO
helm repo add bitnami https://charts.bitnami.com/bitnami
helm install minio bitnami/minio --set persistence.enabled=false

# We retrieve the credentials
export ROOT_USER=$(kubectl get secret --namespace monitoring minio -o jsonpath="{.data.root-user}" | base64 -d)
export ROOT_PASSWORD=$(kubectl get secret --namespace monitoring minio -o jsonpath="{.data.root-password}" | base64 -d)

# We create a 'thanos' bucket
kubectl run --namespace monitoring minio-client --rm --tty -i --restart='Never' --env MINIO_SERVER_ROOT_USER=$ROOT_USER --env MINIO_SERVER_ROOT_PASSWORD=$ROOT_PASSWORD --env MINIO_SERVER_HOST=minio --image docker.io/bitnami/minio-client -- mb -p minio/thanos
For the sake of this demonstration and to keep things simple, I am not using here persistent storage. Obviously, do not replicate this in production, or you will see your data disappear in a snap 🙂
Likewise, for the sake of simplicity, I am operating as an admin, but normally a dedicated user with the right permissions is required (for example for S3)
Configuring Thanos Access to Object Storage
Thanos needs to know how to connect to object storage. We create the Secret to use the storage we just created:
export ENDPOINT="minio:9000" BUCKET=thanos
cat > objstore.yml << EOF
type: S3
config:
  endpoint: "${ENDPOINT}"
  bucket: "${BUCKET}"
  access_key: "${ROOT_USER}"
  secret_key: "${ROOT_PASSWORD}"
  insecure: true
EOF
kubectl create secret generic thanos-objstore --from-file=objstore.yml -o yaml --dry-run=client | kubectl apply -f -
Configuring the Thanos Sidecar
Below, I outline two effective options:
- via prometheus-operator
- via the official Prometheus Helm chart
With the Prometheus-Operator
Custom Resource Prometheus
The prometheus-operator automatically adds the sidecar when filling the thanos section of the Custom Resource Prometheus.
So, you just need to provide the configuration for object storage, with the secret created previously:
spec:
  thanos:
    objectStorageConfig:
      name: thanos-objstore
      key: objstore.yml
If needed, it is possible to configure other elements of the sidecar, like the exact image to use (see the documentation).
Helm Chart Kube-Prometheus-Stack
The kube-prometheus-stack chart not only allows for the configuration of the Custom Resource Prometheus, but also adds a ServiceMonitor to fetch metrics from the sidecar, using the following values:
prometheus:
  prometheusSpec:
    thanos:
      objectStorageConfig:
        name: thanos-objstore
        key: objstore.yml
  thanosService:
    enabled: true
  thanosServiceMonitor:
    enabled: true
Via the Official Prometheus Helm Chart
In the rare case where you’re not utilizing the prometheus-operator in the cluster but rather the Prometheus chart, configuring the sidecar is also possible. This requires slightly longer values:
server:
  extraFlags:
    - web.enable-lifecycle
    - web.enable-admin-api
    - storage.tsdb.min-block-duration=2h
    - storage.tsdb.max-block-duration=2h

  global:
    external_labels:
      prometheus_from: myprom

  service:
    gRPC:
      enabled: true

  sidecarContainers:
    thanos-sidecar:
      image: quay.io/thanos/thanos:v0.31.0
      imagePullPolicy: IfNotPresent
      args:
        - sidecar
        - --prometheus.url=http://localhost:9090/
        - --tsdb.path=/prometheus
        - --grpc-address=[$(POD_IP)]:10901
        - --http-address=[$(POD_IP)]:10902
        - --objstore.config=$(OBJSTORE_CONFIG)
      volumeMounts:
        - mountPath: /prometheus
          name: storage-volume
      env:
        - name: POD_IP
          valueFrom:
            fieldRef:
              apiVersion: v1
              fieldPath: status.podIP
        - name: OBJSTORE_CONFIG
          valueFrom:
            secretKeyRef:
              name: thanos-objstore
              key: objstore.yml
      ports:
        - name: http
          containerPort: 10902
          protocol: TCP
        - name: grpc
          containerPort: 10901
          protocol: TCP
Prometheus requires several configurations:
- Enable the API so that the sidecar can reload in case of configuration changes
- Enable the admin API to retrieve metadata such as
external_labels - Ensure that the blocks generated by Prometheus are not compacted (min == max duration)
- Have at least one external label to identify the Prometheus instance
Next, set up the Thanos sidecar and ensure it’s exposed through the service.
Deploying Other Thanos Components
We will use the comprehensive bitnami/thanos chart. We use the following values:
existingObjstoreSecret: thanos-objstore

query:
  dnsDiscovery:
    sidecarsService: "prometheus-operated"
    sidecarsNamespace: "monitoring"

compactor:
  enabled: true

storegateway:
  enabled: true

metrics:
  enabled: true
  serviceMonitor:
    enabled: true
Then deploy with:
helm upgrade --install thanos bitnami/thanos --values thanos.values.yaml
This results in four Thanos components being installed:
- query, which will use DNS service discovery to connect to the StoreAPI of the sidecar and storegateway
- query-frontend, configured to target query
- storegateway, exposing the content of the object storage
- compactor, handling compaction and retention in the object storage
By default, the compactor and storegateway require a persistent volume. In reality, they can however do without, the startup will just be longer for the storegateway (the time to synchronize the metadata from the object storage) and the compactor will work on ephemeral-storage (be careful to set resources limits in this case). For simplicity of the demo, I will disable it:
compactor:
  enabled: true
  persistence:
    enabled: false

storegateway:
  enabled: true
  persistence:
    enabled: false
The chart is flexible enough to configure the various Thanos parameters (cache, retention duration, …) and Kubernetes manifests (ingress, resources, affinity/taint, …).
An example of configuration:
query:
  replicaCount: 3
  replicaLabel: prometheus_replica
  podAntiAffinityPreset: hard
  pdb:
    create: true
  existingSDConfigmap: thanos-storeapi-file-sd
  extraFlags:
    - --query.promql-engine=thanos

queryFrontend:
  replicaCount: 2
  podAntiAffinityPreset: hard
  pdb:
    create: true
  extraFlags:
    - '--query-frontend.downstream-tripper-config="max_idle_conns_per_host": 100'
  config: |-
    type: REDIS
    config:
      addr: 'redis:6379'

compactor:
  enabled: true
  retentionResolutionRaw: 90d
  retentionResolution5m: 180d
  retentionResolution1h: 2y

storegateway:
  enabled: true
  replicaCount: 2
  podAntiAffinityPreset: hard
  pdb:
    create: true
  config: |-
    type: REDIS
    config:
      addr: 'redis:6379'
      cache_size: '1G'
With these values, we have:
- The query, query-frontend, and storegateway with multiple replicas, anti-affinity (
requiredDuringScheduling) between them, and PodDisruptionBudgets - The choice of the label that differentiates the HA Prometheus replicas on the query (
replicaLabel) - The use of a ConfigMap with the list of StoreAPI for the query’s service discovery
- Additional arguments for the query and query-frontend to configure certain options
- The configuration of Redis as a cache for the query-frontend and the storegateway
- The retention durations of different metrics applied by the compactor
Using Thanos Instead of Prometheus
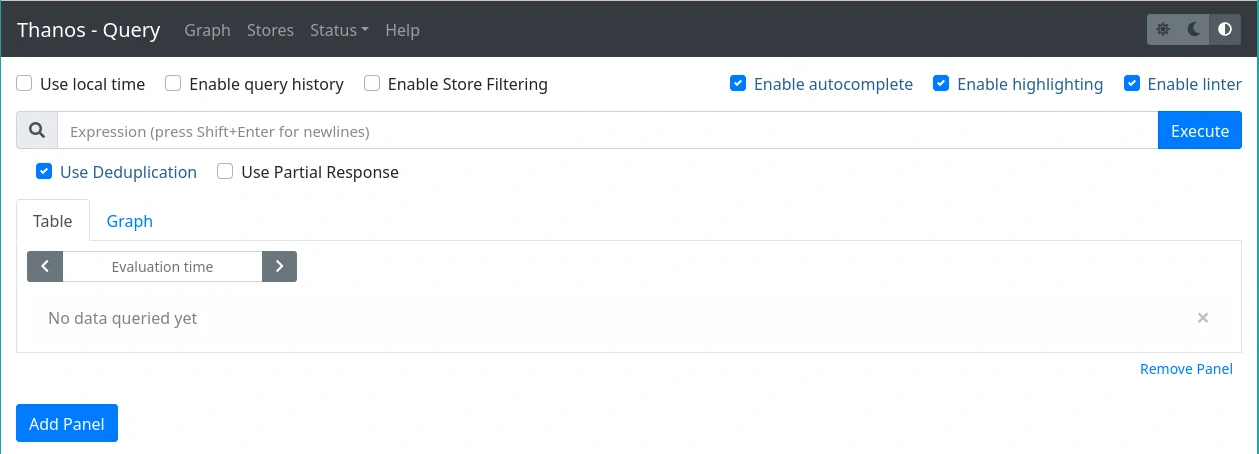
For PromQL Queries via WebUI
The Thanos query provides an interface similar to Prometheus. It can be accessed via port-forwarding or by configuring an ingress. If the query-frontend is used, it is in its values that the ingress must be configured:
queryFrontend:
  ingress:
    enabled: true
    hostname: thanos.example.com
    ingressClassName: public
We find the capability to perform PromQL queries, just like with Prometheus:
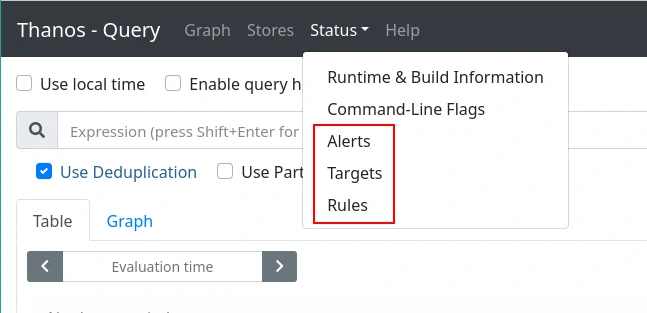
The alerts, targets, and rules from different Prometheus instances are also accessible:
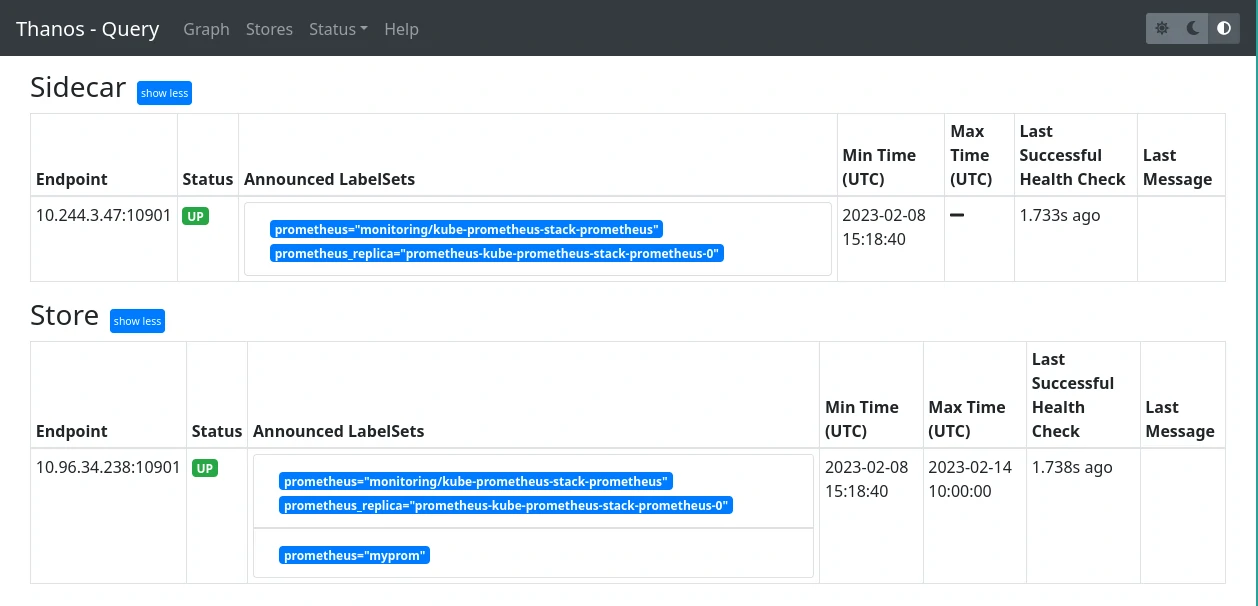
And one can list the different configured StoreAPIs on the query:
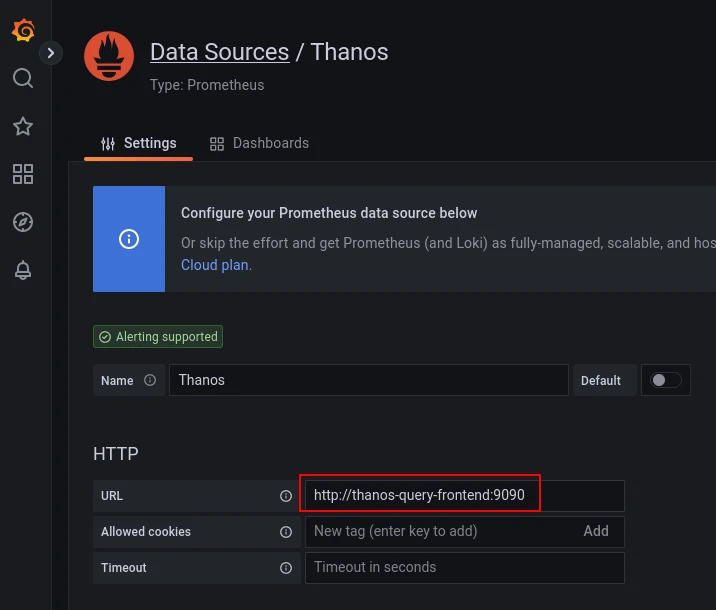
Thanos as a Datasource for Grafana
Thanos is most frequently used in conjunction with Grafana. Thanos query exposes the same API as Prometheus, so all it takes is to add a Prometheus type datasource in Grafana and target the Thanos query (or query-frontend if deployed):
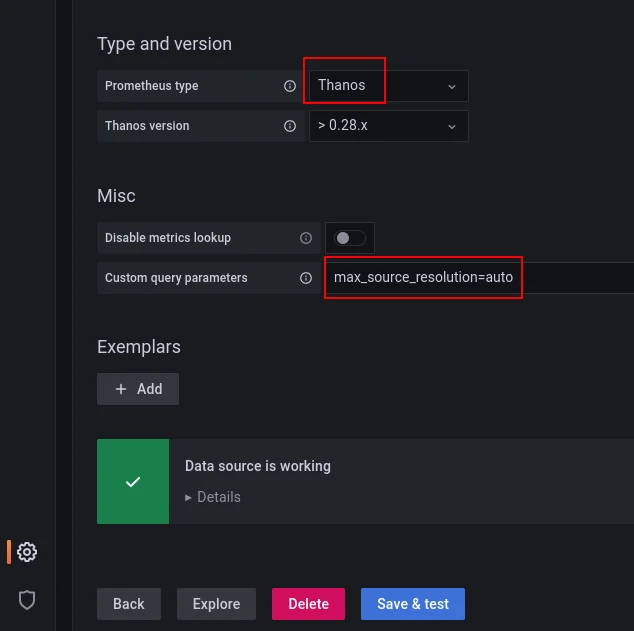
It is possible to indicate to Grafana the type of Prometheus datasource and provide parameters for queries. For example, to specify that you want to retrieve the automatically downsampled versions of the metrics based on the resolution:
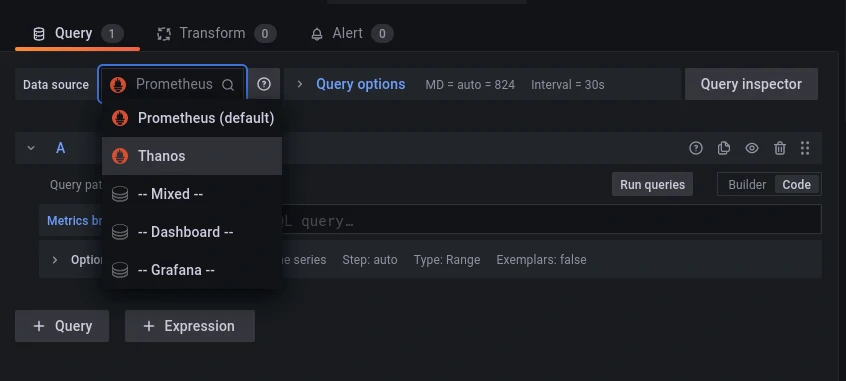
The final step is to employ it as a datasource, either for a panel or during a dashboard import:
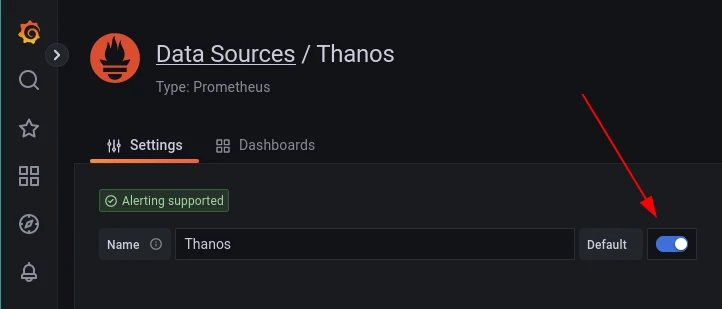
Or even better, configure the new datasource as the default one, since Thanos query allows having multiple queryable Prometheus instances behind it.
The concluding article in our Thanos series delves into the scenarios where it’s pertinent to expose multiple Prometheus instances behind Thanos.
Do not miss our latest DevOps and Cloud Native blogposts! Follow Enix on Linkedin!