
This article kicks off our three-part series on Thanos monitoring.
- Part 1: “Thanos: Long-term Storage for Prometheus Metrics”
- Part 2: “Deploying Thanos and Prometheus on a K8s Cluster”
- Part 3: “Thanos: Aggregating Multiple Prometheus”
This initial article introduces Thanos used for long-term collection of Prometheus metrics.
By default, the retention duration for Prometheus metrics is 15 days. To keep them for a longer period (months, or even years), the first reflex would be to increase Prometheus’s retention duration.
However, it’s commonly understood that Prometheus isn’t inherently designed for this purpose, leading to the need for an additional component like Thanos. But why is that?
Prometheus: Short-Term Storage by Design
Prometheus has opted to maintain simple metrics storage, on the local disk of the instance.
One of our goals was to run a Prometheus server with millions of time series and tens of thousands of samples ingested per second on a single server using its local disk. You might think everything should be distributed-something nowadays, but distributed systems demand payment in complexity and operational burdens.
This design promotes efficient storage while simplifying the deployment of Prometheus.
However, the necessary disk space will increase with the quantity of metrics. Nowadays, Terabyte prices are rather affordable, but redundancy (a disk can fail) or data corruption (the more data, the higher the probability of corrupted data) also need to be considered. Nothing insurmountable, but this represents a cost.
Again, Prometheus’s local storage is not intended to be durable long-term storage; external solutions offer extended retention and data durability.
Another element to consider is the amount of data required to respond to a query. To graph the history of a metric over a year, with Prometheus querying an [exporter] every minute, you will need to retrieve 60m*24h*365d points. On a full Grafana dashboard, the total quantity of points to retrieve can quickly become high, consuming a lot of resources and increasing display time.
While Prometheus does technically support long-term metric storage, best practices and operational and budgetary constraints encourage the use of a more suitable component like Thanos.
![]()
Concept and Operation of Thanos with Prometheus
Thanos is divided into several components, each with its task and that can scale independently of each other to manage the load if necessary.
The entire system hinges on two core elements:
- An object storage to keep all the metric history and some metadata
- A communication interface in gRPC named StoreAPI, to allow inter-component exchanges
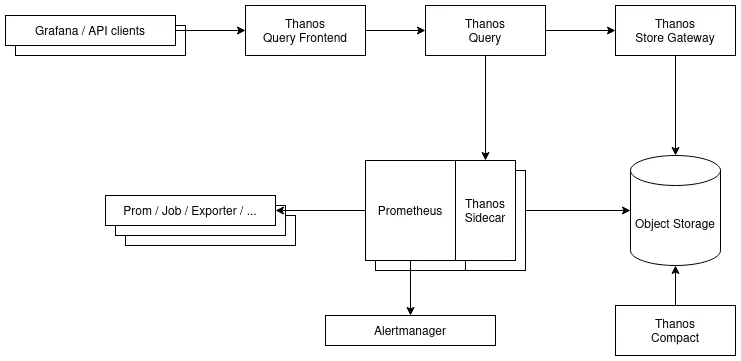
In a standard operation, Prometheus is in charge of collecting metrics from the exporters and sending alerts to Alertmanager. Here, we will minimally add the following components:
- A Sidecar to Prometheus, to expose recent metrics and send them to object storage
- A Store Gateway for access to the metric history from object storage
- A Query (or Querier) to access historical metrics from the Store Gateway and recent metrics via the Sidecar
- A Compactor to manage retention and optimize metrics in object storage
A simplified deployment example (more complete version) :
Thanos Sidecar: Uploading History to Object Storage and Auto-Reload
This component operates in tandem with Prometheus. The Thanos Sidecar performs three functions:
- Upload metric blocks (by default, Prometheus creates one every two hours) to object storage for long-term storage;
- Monitor the configuration and Prometheus rules, to restart the server in case of changes;
- Expose metrics on the StoreAPI, to query recent metrics that have not yet been sent to object storage.
Thanos Store Gateway: Accessing metrics in object storage
Once in the object storage, it’s essential to utilize the metrics in the same manner as those on Prometheus’s local storage. This is where the Thanos Store Gateway comes into play. It acts as a bridge to the object storage and exposes it via the StoreAPI (read-only).
By default, the Store Gateway handles all data in the object storage. However, to manage large data volumes more efficiently, it’s also possible to implement sharding.
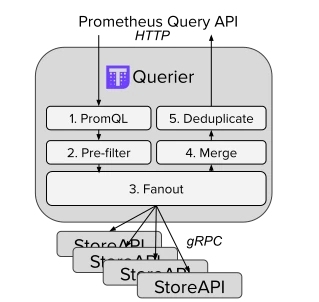
Thanos Query: The PromQL/StoreAPI Interface
The Thanos Query component bridges the gap between programs that use the Prometheus API to make PromQL queries (like Grafana) and the StoreAPI exposed by various Thanos components (or third-party programs that implement the StoreAPI).
Besides providing a global view of different StoreAPIs (e.g., multiple Prometheus with a Thanos sidecar), Thanos Query offers beneficial features:
- Metric deduplication (for high-availability Prometheus setups)
- Automatic downsampling (to reduce the amount of raw data retrieved during a PromQL query)
- Concurrent query management to maximize the distributed nature of Thanos.
A web interface, similar to that of Prometheus, also allows direct querying.
Thanos Compactor: Compaction, downsampling, and retention
Compaction
By default, blocks containing metrics are generated every 2 hours and sent to object storage. Prometheus compacts these blocks to optimize space: after some time, they are merged to share common structures. With Thanos, the Compactor takes over this task.
Downsampling
The Compactor also handles downsampling, which involves creating aggregated versions of metrics over a specific time frame. Thanos creates aggregates with data points every five minutes and another every hour.
This approach reduces the amount of data retrieved when high precision isn’t necessary. For instance, with a metric collected every minute, using raw data would require 60m*24h*365d points for a year’s graph. With the aggregated hourly version, the number of points to retrieve is cut by 60, saving data transmission and resulting in quicker rendering.
If you need to zoom into a graph segment, you’ll revert to more precise values: depending on the desired resolution, either the five-minute point aggregation or raw data.
Retention
The Thanos compactor also applies retention duration and deletes blocks from object storage after this period is exceeded.
Optional Thanos Components
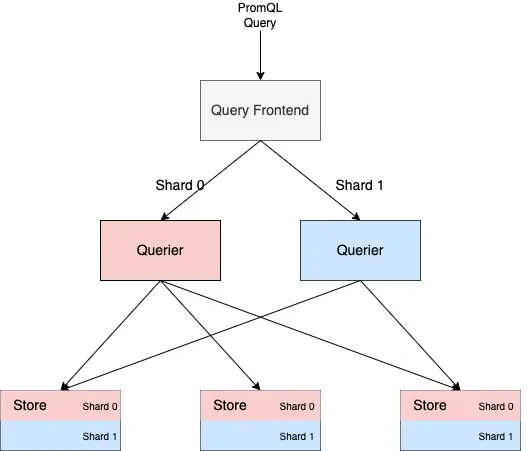
Thanos Query Frontend: PromQL query caching and optimization
The Thanos Query Frontend sits in front of the Thanos Query and offers features to enhance the response times of PromQL queries:
- Caching for results, to reuse them (even partially) in future queries.
- Temporary error management, with a retry mechanism for fetching results.
- On-the-fly sharding of queries for better parallelization, such as splitting a week-long query into several daily ones.
Thanos Receiver: Metric retrieval via remote_write
In some cases, the Thanos Query might not directly reach the Thanos sidecar attached to Prometheus, e.g., in a platform on an isolated network. In such a situation, you can still use the sidecar to push metric blocks into object storage, but you lose access to the latest metrics that Prometheus hasn’t yet consolidated into a block.
To address this, you can use the Thanos Receiver which implements Prometheus’s Remote Write API. You simply configure remote_write on the Prometheus side to send data to the Thanos Receiver, which then acts like the sidecar in placing metrics into object storage.
Thanos Rule: Evaluating recording/alerting rules outside of Prometheus
Typically, Prometheus oversees the management of recording and alerting rules.
In certain scenarios, you might want to delegate this to Thanos, especially if you aim to set rules targeting metrics from two different Prometheus setups or over a retention period longer than that of Prometheus.
This is made possible by the Thanos Rule (or Thanos Ruler), which uses metrics available on the Thanos Query to evaluate its rules. However, beware, this isn’t entirely [risk-free] as you’re adding intermediary components that could potentially become unavailable.
Eager to dive into hands-on practice?
The next article in this monitoring series delves into the details of deploying these Prometheus and Thanos components on a freshly monitored Kubernetes cluster using kube-prometheus-stack.
Do not miss our latest DevOps and Cloud Native blogposts! Follow Enix on Linkedin!