
If you’re reading this article, chances are you’re well-versed in Kubernetes and Prometheus… Fortunately, that’s the very topic we’re diving into!
From defining to scraping and all the way to deployment, I’ll cover nearly every aspect of the exporter we’re about to craft together. Don’t worry, it’ll go smoothly. 😉
Before diving in, it’s worth noting that I’m working on a sandbox cluster with Prometheus already set up using prometheus-operator.
What is a Prometheus Exporter?
Let’s kick things off with some theory. Prometheus exporters are both common and abundant; for a comprehensive list, you can refer to the official documentation here.
Let’s briefly recall what it is and its purpose.
The simple definition: it’s mainly a server that returns standardized metrics for Prometheus, structured like this:
# HELP prometheus_engine_query_log_enabled State of the query log.
# TYPE prometheus_engine_query_log_enabled gauge
prometheus_engine_query_log_enabled 0
# HELP prometheus_engine_query_log_failures_total The number of query log failures.
# TYPE prometheus_engine_query_log_failures_total counter
prometheus_engine_query_log_failures_total 0
Yes, it’s clearly less appealing than Grafana dashboards, but remember that those beautiful curves you visualize on Grafana originate from this data!
So, do we have to manually write all these metrics? Thankfully, no! It’s important to note that Prometheus provides several libraries to define and expose your metrics based on the language your exporter uses:
And other unofficial libraries can be found here.
How to Create a Prometheus Exporter?
Now, let’s move on to the practical side, let’s begin by setting up a basic HTTP server.
For this tutorial, I’ll use the python language and the official client library. But as mentioned earlier, many other languages of your choice could be used to achieve your goals.
The ssserver 🐍
I’ll spare you the basics of project creation and dive right into the server code.
This code is a demo of the library we’re using: prometheus_client, which is the official python client for Prometheus.
from prometheus_client import start_http_server, Summary
import random
import time

# Create a metric to track time spent and requests made.
REQUEST_TIME = Summary('request_processing_seconds', 'Time spent processing request')

# Decorate function with metric.
@REQUEST_TIME.time()
def process_request(t):
    """A dummy function that takes some time."""
    time.sleep(t)

if __name__ == '__main__':
    # Start up the server to expose the metrics.
    start_http_server(8000)
    # Generate some requests.
    while True:
        process_request(random.random())
example code provided by Prometheus’s client_python library
In this simple code, we have a server accessible from port 8000, returning basic metrics provided as an example.
Once executed, a simple curl 127.0.0.1:8000 command lets you view the metrics.
# HELP python_gc_objects_collected_total Objects collected during gc
# TYPE python_gc_objects_collected_total counter
python_gc_objects_collected_total{generation="0"} 322.0
python_gc_objects_collected_total{generation="1"} 43.0
python_gc_objects_collected_total{generation="2"} 0.0
# HELP python_gc_objects_uncollectable_total Uncollectable object found during GC
# TYPE python_gc_objects_uncollectable_total counter
python_gc_objects_uncollectable_total{generation="0"} 0.0
python_gc_objects_uncollectable_total{generation="1"} 0.0
python_gc_objects_uncollectable_total{generation="2"} 0.0
# HELP python_gc_collections_total Number of times this generation was collected
# TYPE python_gc_collections_total counter
python_gc_collections_total{generation="0"} 38.0
python_gc_collections_total{generation="1"} 3.0
python_gc_collections_total{generation="2"} 0.0
# HELP python_info Python platform information
# TYPE python_info gauge
python_info{implementation="CPython",major="3",minor="9",patchlevel="2",version="3.9.2"} 1.0
# HELP request_processing_seconds Time spent processing request
# TYPE request_processing_seconds summary
request_processing_seconds_count 21.0
request_processing_seconds_sum 8.899460147999998
# HELP request_processing_seconds_created Time spent processing request
# TYPE request_processing_seconds_created gauge
request_processing_seconds_created 1.619795017426719e+09
A snake in the container 📦
As you can probably anticipate, the next logical move is to containerize this server and roll it out on your ideal Kubernetes cluster
For this, it’s straightforward. Create your Dockerfile like this:
FROM python:3.9-slim

WORKDIR /app
COPY . /app/

RUN pip install prometheus-client

EXPOSE 8000

CMD python -u src/server.py
And run it, making sure to map your container’s port.
docker build -t kkonovod/pyprom:latest .
docker run --name pyprom -dp 127.0.0.1:8000:8000 kkonovod/pyprom:latest
As mentioned earlier, curl 127.0.0.1:8000 to view the metrics.
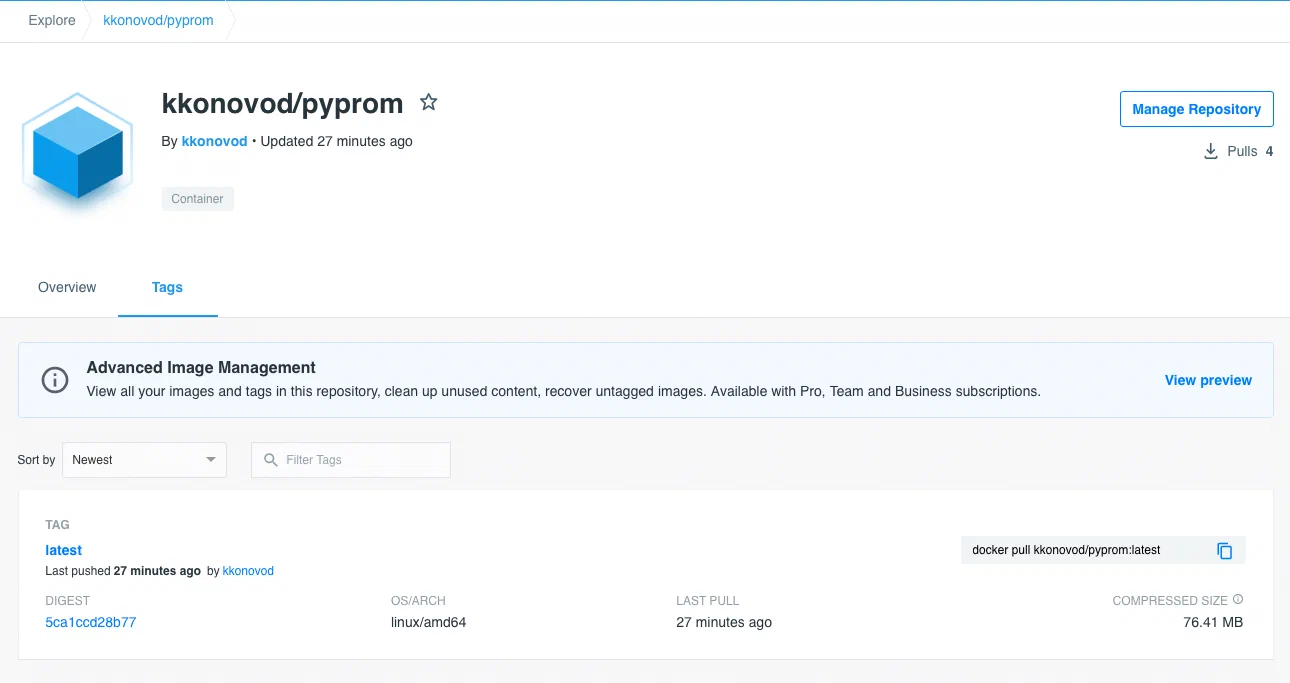
To conclude this section, there’s one last essential step: pushing your image to Docker Hub. This can be done in three simple steps:
docker loginto authenticate,docker build -t <user>/pyprom:latest .to build with your Docker Hub username,docker push <user>/pypromto push the image to Docker Hub.
After this, your image will be publicly accessible and can be used by our upcoming Kubernetes pod!
All Hands on Deck 🚢 (Without Helm)
Now, it’s time to deploy everything into a cluster. Let’s dive in!
⚠️ We won’t cover Kubernetes cluster creation here, but you can refer to this article for installation methods based on Rancher.
To deploy everything into a Kubernetes cluster, we’ll need several components:
- A pod where our container will run.
- A service to expose the pod.
- A servicemonitor to allow Prometheus to collect our metrics.
We could use a package manager like Helm or Kustomize, but let’s keep things simple, in line with this blog post. We’ll create a .yaml file for each Kubernetes object to deploy.
For practical reasons, I recommend creating a dedicated folder (in my case, “manifests”) at the project root to store the .yaml files.
Pod
The essential pod that deploys our simple Python server.
apiVersion: apps/v1
kind: Deployment
metadata:
  name: pyprom
spec:
  replicas: 1
  selector:
    matchLabels:
      app: pyprom
  template:
    metadata:
      labels:
        app: pyprom
    spec:
      containers:
      - name: pyprom
        image: kkonovod/pyprom
        ports:
        - containerPort: 8000
We add a label, app: pyprom, to be identified by our future service. And don’t forget port 8000, which corresponds to the Python server, recall start_http_server(8000).
Service
The crucial service that bridges the gap between the pod(s) and the upcoming servicemonitor.
apiVersion: v1
kind: Service
metadata:
  name: pyprom
  labels:
    app: pyprom
spec:
  selector:
    app: pyprom
  ports:
    - name: metrics
      port: 9253
      targetPort: 8000
      protocol: TCP
It’s essential to note the port 9253, even if it’s just an example, since Prometheus exporters must adhere to a port allocation standard. More info here. Also, the port name (metrics) is intentional, as the servicemonitor will use this name to retrieve the port.
ServiceMonitor
And of course, a servicemonitor that monitors a set of services to enable Prometheus metric discovery.
apiVersion: monitoring.coreos.com/v1
kind: ServiceMonitor
metadata:
  name: pyprom-servicemonitor
  namespace: monitoring
  labels:
    app: pyprom
    release: prometheus-operator
spec:
  selector:
    matchLabels:
      app: pyprom
  endpoints:
  - port: metrics
    interval: 15s
Nothing special in this straightforward .yaml, but pay attention to two parameters:
- “release: prometheus-operator”: Label used by Prometheus for discovering this
servicemonitor. - “matchLabels”: The labels used to identify the
servicesto monitor.
💡 The
servicemonitormust be in the same Kubernetes namespace as Prometheus!
Our directory structure looks like this:
.
├── Dockerfile
├── Pipfile
├── Pipfile.lock
├── manifests
│   ├── pod.yaml
│   ├── service.yaml
│   └── servicemonitor.yaml
└── src
    └── server.py

2 directories, 7 files
And finally, we run the following command:
kubectl apply -f chart/ -n <namespace>
Not So Scary After All
As you can see, it’s quite intuitive. You can now navigate to your go-to Prometheus server and look up the custom metric we just crafted.
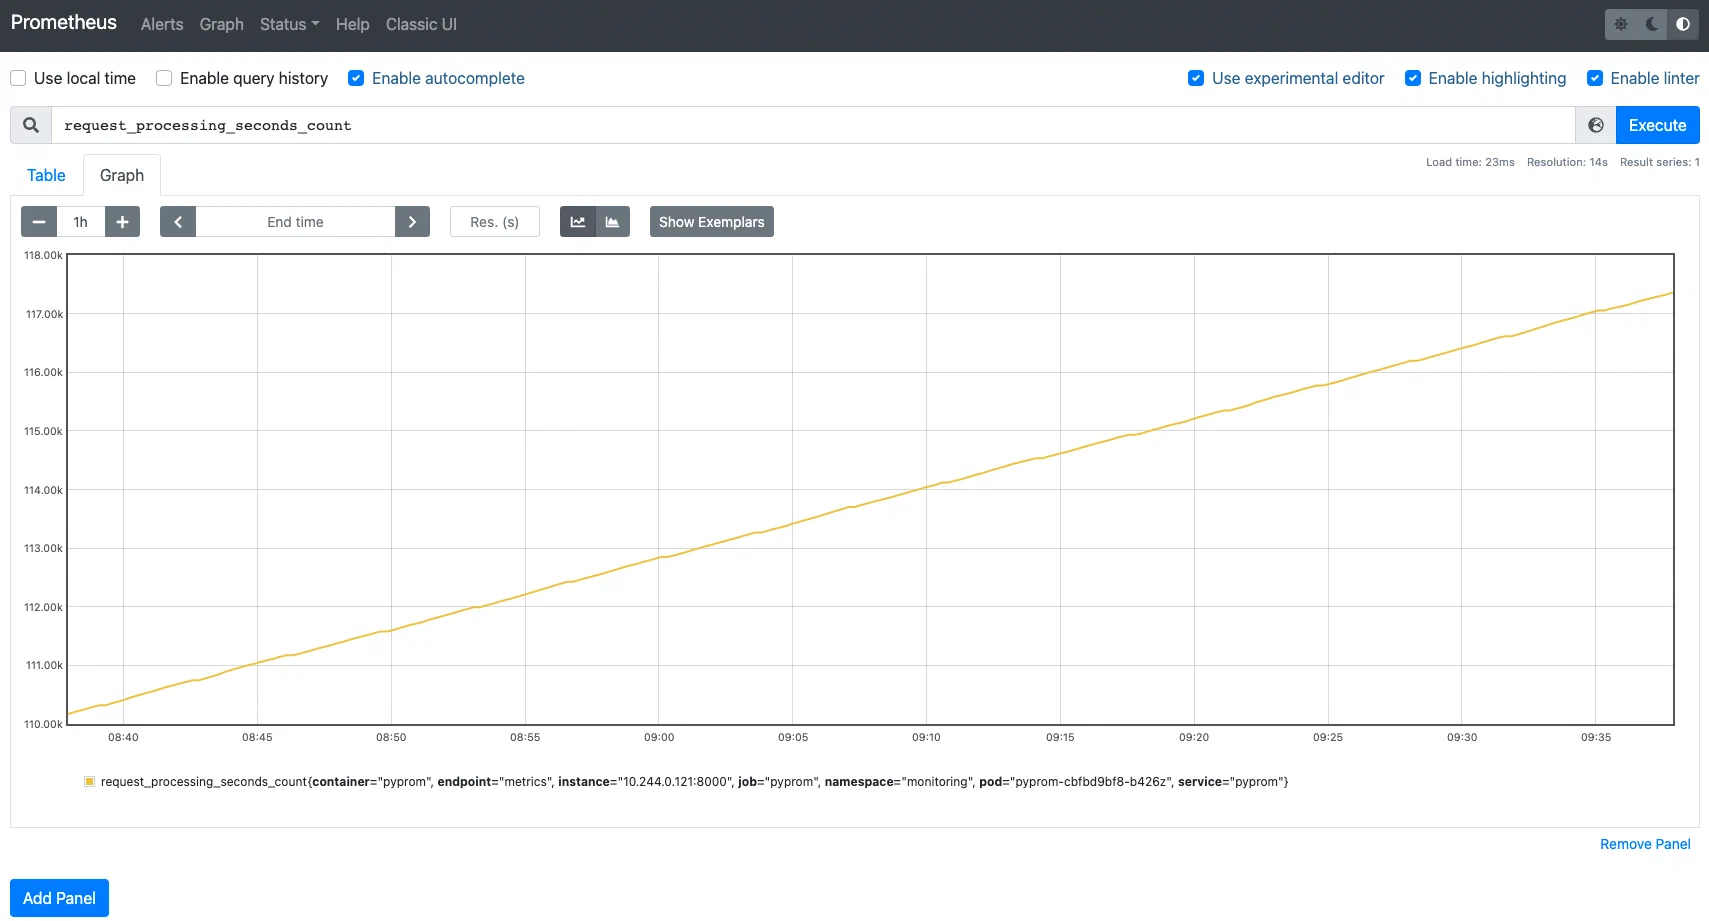
If you’re still here, first off, thank you… and kudos: you’re the proud creator of a brand-new exporter!
If you’re interested in a more complex Prometheus exporter, feel free to check out our open-sourced Certificate Exporter. It greatly simplifies the management and operation of certificates in Kubernetes clusters.
Do not miss our latest DevOps and Cloud Native blogposts! Follow Enix on Linkedin!