
(Article updated on 02/10/2025).
If you’re regularly managing Kubernetes clusters, you’ve probably noticed the repetitive nature of typing out kubectl commands.
Listing pods or deployments, switching namespaces, viewing container logs, editing or deleting resources… these actions are relatively simple but can quickly become tedious. (you can check my articles on Kubectl Commands and Advanced Kubectl Commands).
K9s is a robust tool designed to simplify these routine tasks on your clusters. In this article, we’ll walk you through K9s using a Prometheus stack example. I’ve included brief demo videos for clarity, eliminating the need for your to have your own Kubernetes cluster.
What is K9s?
K9s, similar to Lens, is a Kubernetes cluster management tool via a user interface.
K9s offers continuous monitoring of your Kubernetes cluster. It notably offers:
- A good understanding of your K8s cluster and a clear visibility of resource status
- Easier navigation through cluster resources
- An opportunity to interact simply with these resources
A key distinction between K9s and Lens is K9s’s terminal-based operation, whereas Lens functions as a conventional desktop application. Both solutions are very interesting and have their own advantages. Today, we will explore K9s together!
In the following sections, we will discover how to use K9s in a practical example on a Prometheus stack. We will see K9s’s basic features as well as advanced functionalities. Everything will be demonstrated on a pre-configured K8s cluster on our Enix cloud comprising 4 nodes, of which 3 are workers and 1 is a master.
K9s: Installation and Access to a Kubernetes cluster
Imagine joining a new team within your company. You are responsible for a production cluster you’ve never managed before. Your colleagues provide you with a .kube/config.yaml file to access this Kubernetes cluster. Without further ado, let’s take a look!
Let’s start by installing K9s. I invite you to follow this K9s installation guide explaining how to setup K9s on MacOS, Linux, and Windows.
Once K9s is installed, you can run it from the terminal with the k9s command. If you use multiple config.yaml files, you can choose which one to use with the --kubeconfig flag, like this: k9s --kubeconfig ~/.kube/config.yaml. If there are multiple contexts, you’ll be asked to choose one. Otherwise, K9s will display the list of cluster pods in the default namespace.
Upon reopening, K9s will display the last type of resource consulted, in the last selected namespace.
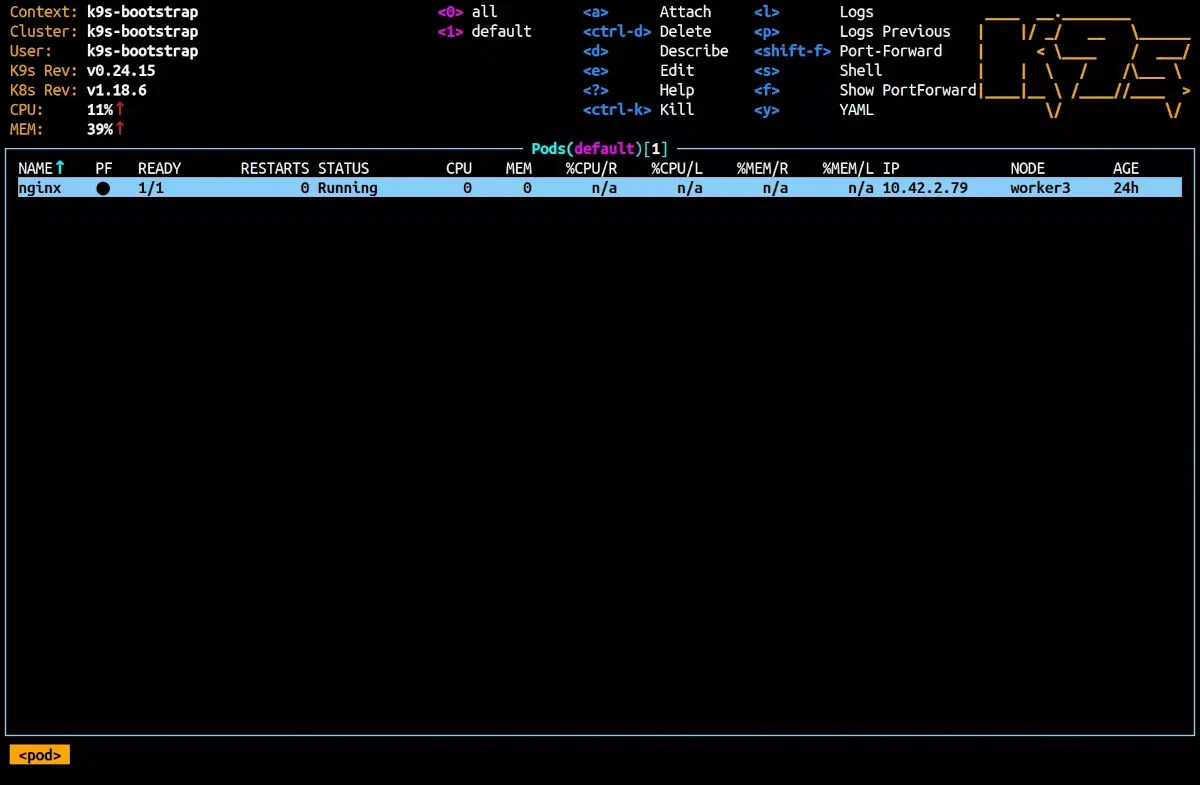 The Nginx pod shown above is just an example; we won't use it in this article.
K9s showcases a variety of details about the Kubernetes resources. Take a pod, for instance: its age, the node it runs on, the RAM consumption, and its name. Without K9s, this data would be accessed using kubectl get pods and kubectl top pods commands. On K9s, by default, these details are updated every 2 seconds, but you can modify this parameter using the --refresh flag. For updated every second, just input k9s --refresh=1.
The top section of the K9s UI provides insights about K9s itself and the cluster under observation. It also lists some of the commands options. To view the complete command list, hit the h key.
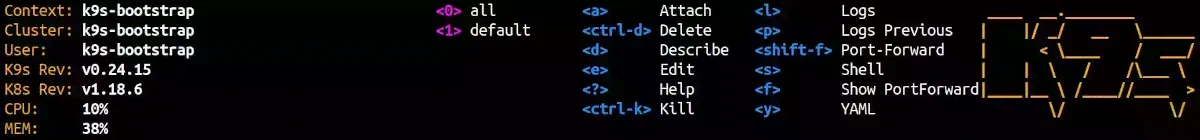
You’ll also notice labels accompanied by digits. These represent shortcuts for namespace filtering. The 0 key displays resources in all namespaces, 1 displays the default namespace, and as you explore different namespaces, more shortcuts become available.
Displaying pods from all namespaces, we can notice that one pod is in red. The line colors provides insights about the observed resource. For example, a cyan pod is in the Running state; red indicates an error, while purple indicates the pod is being terminated.

K9s and Prometheus: Debugging session
Now that we’re familiar with this new cluster, it would be a shame to stop here. Let’s tackle debugging this infamous pod!
There are many pods displayed in our list. To kick things off, let’s switch between namespaces. Hit the : key, type in namespace (or an alias, like ns for example), and press enter. You can now see the available namespaces on the cluster. Let’s select the monitoring namespace, where our problematic pod is located.
To filter the visible resources, the / shortcut allows for a search, as we’re used to with man, less, etc…
That’s much better. Now, we could run a describe on the problematic pod to identify potentially insightful events.
Inspecting a pod with K9s
Navigate to the error pod and press d. In the events, you see a series of “Back-off restarting failed container”, which aligns with what we see in the pod’s status column (CrashLoopBackOff).
Let’s check the logs for more details. Exit the describe view with the ESC key, then press l to display the pod logs. You can now see the logs from all the pod’s containers.
Exit this view, then access to the pod details with the enter key. We can now display logs for each individual container and see additional information such as the images the containers employ. Display the logs of the red container.
level=error ts=2021-08-30T15:34:17.018Z caller=main.go:347 msg="Error loading config (--config.file=/etc/config/prometheus.ym)" err="open /etc/config/prometheus.ym: no such file or directory"
Correcting a deployment
The configuration file’s path appears to be misconfigured, likely an error in the arguments of the program executed in the container. Let’s check the pod’s configuration. Exit the logs and container views, then tap y to display the pod’s yaml.
As suspected, the flag --config.file=/etc/config/prometheus.ym is misspelled, missing a letter in the configuration file’s extension. Let’s fix this. You know that this pod was created via a deployment, so revert to the pod list, press the : key, and enter deployments. Go to the red deployment and press e to edit. Add the missing “l” to the extension, then save and exit.
The pod has finally turned cyan, and its status is Running! Now, let’s try accessing the Prometheus dashboard to ensure everything works.
Accessing the Prometheus dashboard via port-forwarding
To access the Prometheus dashboard, we’ll sidestep the hassle of configuring ingress and opt for port forwarding. In k9s, initiating this on a pod is as simple as shift+f. Press shift+f on the prom-prometheus-server pod and keep the default configuration. The Prometheus dashboard is now available at localhost:9090.
In the video above, we end by deleting the port-forwarding just as an example. For the purpose of this article, assume we didn't actually delete it.
Upon checking the dashboard, we see that no metrics are available. We were told that metrics were already set up! However, something tells me there’s an issue with the exporters… 😉.
Actions on resource groups
Based on this intuitive insight 🧙, one might consider deleting all Prometheus exporter instances to ensure they’re correctly recreated by their daemonset as a last-resort solution. However, since we’re eager to experiment with our new tool, let’s give it a try.
To delete pods faster, initiate by marking them, then proceed to delete them as a group. To select a pod (or any other resource type), press the space key, and the same to deselect it. You can select multiple pods simultaneously. In fact, if you press ctrl+space after selecting the first pod, all pods between the two will be selected. Once your selection is done, you can perform your grouped action, such as deleting the selected pods.
Opening a shell in a container
Alright, the pods are back, but we still have no metrics on our dashboard! Let’s try to retrieve the metrics of an exporter from a cluster container. Simply press the s key over a pod or container to launch a shell. We can then query the service in question: curl prom-prometheus-node-exporter:9100/metrics.
The exporter pods are operational, but their APIs are evidently unreachable, likely a service configuration issue.
Inspecting the service monitoring/prom-prometheus-node-exporter, we notice a typo in the selector configuration with a double “o” in component: noode-exporter. Let’s correct this and apply the modification. Repeat the previous step, and this time, we can successfully curl the service, and the metrics are finally available on the dashboard.
Special K9s Commands
In addition to commands that allow you to select a specific type of resource, such as configmaps or ingresses, K9s provides some “special” commands that offer an alternative way to observe the cluster beyond a simple resource listing.
K9s workloads
Introduced in version v0.30.0, the workloads command allows you to list all daemonsets, deployments, replicasets, pods, and services in a cluster in one go. This is useful for quickly understanding what is running in your cluster and how (daemonset, deployment?) without having to inspect each resource individually.
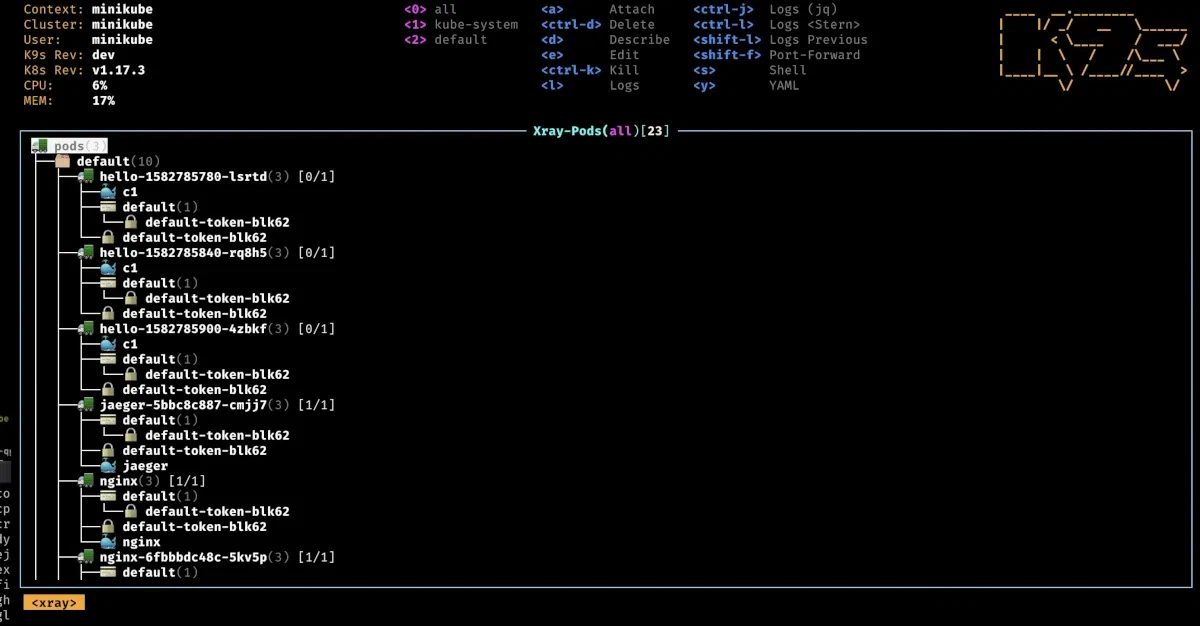
K9s xray <resource>
The Xray command displays a tree view of a specific resource type and its related resources. This is particularly useful for getting a high-level overview at a glance. For example, running xray pods will show you the containers in each pod, the configmaps they use, and other relevant details.
⚠ Note: If your cluster is heavily loaded, this command may take some time to execute.
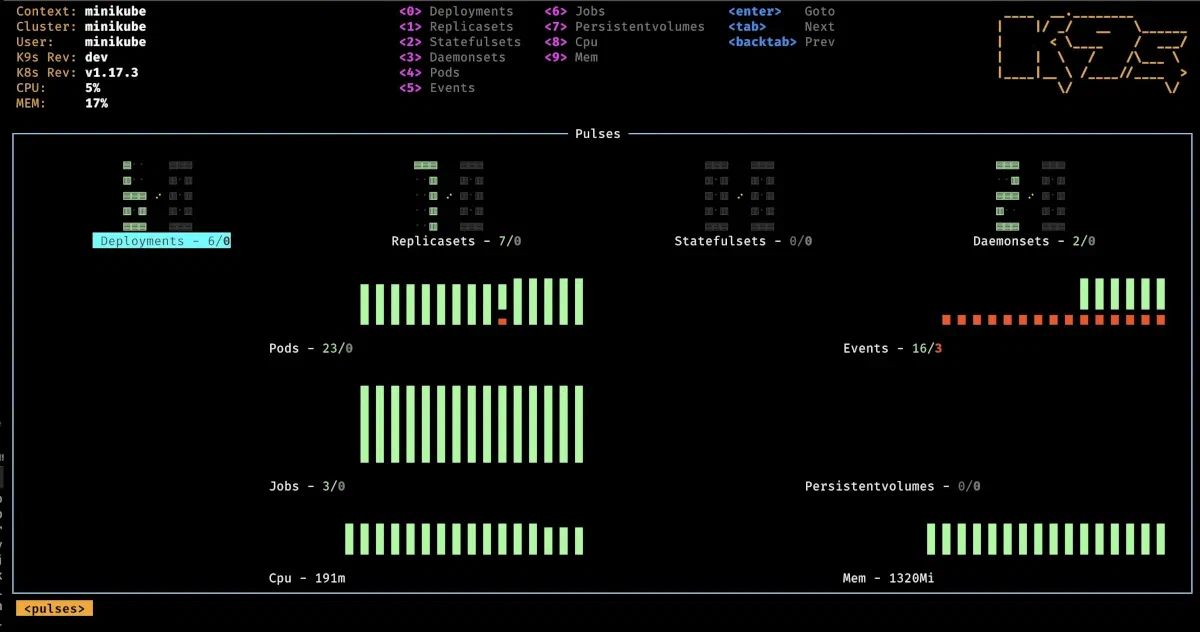
K9s pulse
The pulse command provides a quick way to monitor various cluster metrics.
⚠ Note: This feature requires a properly functioning metrics server to be installed in your cluster.
Advanced K9s Configurations
Beyond basic configurations like refresh rate (k9s.refreshRate), the pod used for shell access (k9s.shellPod), or enabling mouse support (k9s.ui.enableMouse), K9s allows for advanced customization via shortcuts and aliases.
⚠ Configuration files for these features are separate from the main configuration. The files are named aliases.yaml and hotkeys.yaml. You can locate them using the k9s info command.
Aliases: Shortening Commands
Aliases allow you to replace long commands or resource names with shorter alternatives. Any command entered in K9s’ command bar can be aliased.
For example, you could create an alias dns to list all pods in the kube-system namespace with the label k8s-app=kube-dns:
aliases:
  dns: pod kube-system k8s-app=kube-dns
Now, simply typing dns will execute pod kube-system k8s-app=kube-dns.
Hotkeys: Executing Commands with Shortcuts
Hotkeys work similarly to aliases but do not require typing a command—instead, a keyboard shortcut triggers the linked command. Hotkeys can also reference aliases.
Example:
hotKeys:
  shift-0:
    shortCut:    Shift-0
    description: Viewing kube-dns pods in kube-system namespace
    command:     dns
  x:
    shortCut:    x
    description: XRay Deployments
    command:     xray deploy
With this configuration:
- Pressing
Shift+0will execute thednsalias. - Pressing
xwill trigger an XRay view of deployments.
You can view hotkeys in K9s by pressing ?.
Bonus: K9s Skins! 🎨
For those who appreciate aesthetics, K9s allows full color customization through skins!
To apply a skin, set the desired theme in your main K9s configuration under k9s.ui.skin. For example, to use the Dracula theme:
k9s.ui.skin: dracula
You can add custom skins in the $XDG_CONFIG_HOME/k9s/skins directory. A collection of pre-configured skins is available in the K9s repository.
K9s, in summary
With this scenario, we have explored various features and use cases of K9s.
Among these, we highlighted resource listing, editing or deleting of them, as well as advanced capabilities like port-forwarding or initiating a shell in a container. We use them daily at Enix, especially for managed services of our clients’ cloud-native platforms.
This overview isn’t exhaustive; K9s offers many other features to assist you daily in managing your K8s clusters. To delve deeper, I invite you to check out the K9s’s documentation, which includes numerous tutorials and examples.
Do not miss our latest DevOps and Cloud Native blogposts! Follow Enix on Linkedin!