
Today, we will see how we can “connect” the Prometheus Service Discovery with Netbox used as the source of truth for your infrastructures !
Prometheus Service Discovery
Prometheus, a metrology system whose reputation is well established, has the particularity of retrieving the metrics from the device (or target) it monitors. While this “pull” operating mode (as opposed to “push”) has many advantages in terms of scalability and practicality, it nevertheless implies that all the services to be monitored must be declared to the supervision server.
In the context of a very dynamic infrastructure (for example, if it is driven by an orchestration system), it quickly becomes tedious to manually maintain the list of services to be monitored, and the idea of automating all this naturally emerges. Fortunately, Prometheus offers different mechanisms for automatic discovery of services, through numerous service discovery modules.
The code already contains about ten modules allowing you to automatically query components of different systems such as Kubernetes, OpenStack, Google Cloud or even AWS. A particularly interesting mechanism for its flexibility comes from the file_sd module. This module offers a generic way to implement a Prometheus service discovery process through files. It is now even the preferred way of Prometheus developers, rather than adding new specific service discovery modules to their code, making it more complex to maintain. It is therefore by using the file_sd module that you will be able to implement your own Prometheus service discovery system.
Netbox, as a source of truth for Prometheus
We’ve been using Netbox to inventory our entire infrastructure for a few years now. Over time, Netbox has become our source of trust, i.e. the place where the infrastructure is described as it is supposed to exist, and to which automated deployment tools and humans have to refer to reconcile reality with this description. However, it is not easy to maintain such a database because it can quickly diverge from what is actually in place, the weak link being in this case (and as often) the human, especially when it comes to performing the somewhat thankless tasks of data entry. It is therefore in our interest to couple our deployment systems with Netbox, our source of trust, as much as possible.
The declaration of a component in Netbox should ideally be able to orchestrate all the actions revolving around the existence of this device:
- creation of the component itself
- configuration of the network
- creation of accesses for the people who will administer the device
- configuration of the backup tool
- creation of DNS entries
- […]
- and… the configuration of the supervision server. Which as you must have already guessed is what we’re talking about today with a Prometheus server.
At Enix, we have already developed or integrated several such mechanisms. For example, we can deploy and integrate a new hypervisor into one of our OpenStack clusters very simply by filling in a few fields in our Netbox instance.

The latest integration is about monitoring, and more specifically the integration between Netbox and Prometheus. Given the weak coupling between this piece of code and the Enix infrastructure, it seemed like a good idea to publish it for the benefit of other users of these two tools.
The project, very originally named “netbox-prometheus-sd” is available on Github under the MIT license. You are of course invited to come back and contribute if you feel like it!
In the meantime, here are some steps to implement this project on your infrastructure.
1. Netbox configuration
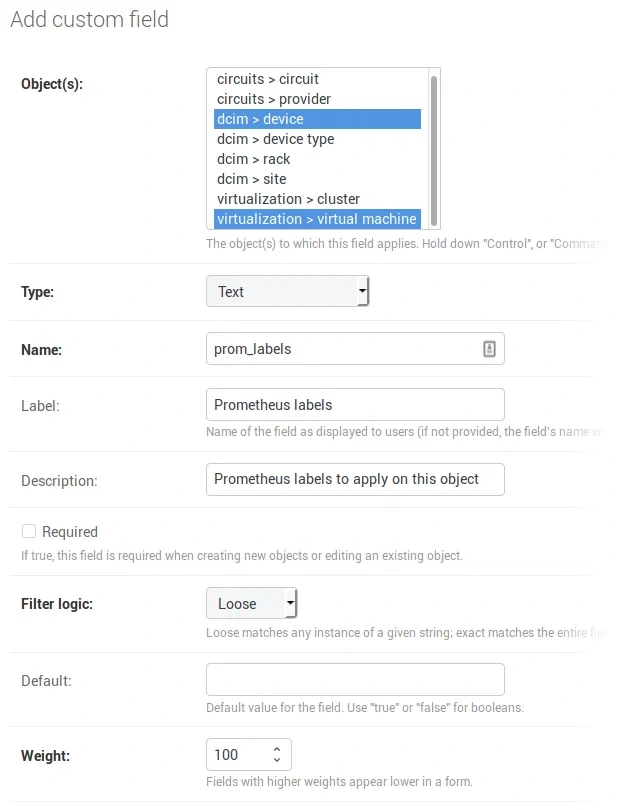
Adding “custom fields”
A custom field must be added in Netbox in order to carry the different labels attached to a device. To do this, go to the Netbox administration area and add a new custom field with the following parameters:
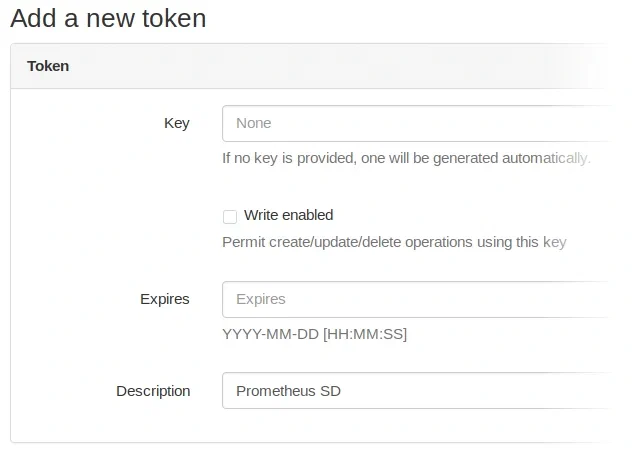
Creation of the API token between Prometheus and Netbox
An API token is also needed to allow netbox-prometheus-sd to connect to the Netbox REST API. The creation of the token is done in your user profile, section “API Tokens”. Create a new token with the following parameters:
Configuring an device in Netbox
In order for a device to be discovered and sent to Prometheus by netbox-prometheus-sd, it must have a primary_ip on one of its interfaces. It is also necessary to enter its custom field prom_labels. This field must be encoded in JSON format, in the following form:
{"foo": "bar"}
Adds on the Prometheus target a label “foo” with the value “bar”.
It is also possible to retrieve several targets per device. This can be useful in case several Prometheus exporters are launched on the same device or when using the exporter_exporter (see below). For this, use a list of JSON objects:
[{"foo": "bar"}, {"bar": "foo"}]
Some labels filled in here are specially interpreted:
__metrics_path__changes the URL path of the target__scheme__changes the URL scheme of the target (typically http or https)__meta_netbox_portchanges the port of the target URL- labels starting with
__param_specify the parameters of the target URL - all labels starting with
__are accessible during the relabeling phase of Prometheus but are not saved
Note that defining the __address__ label at this level does not allow to change the address of the target. In the case of an exporter not running directly on the device pointed to by Netbox (special case of an SNMP server for example), a trick will have to be used (see below, the section “Special cases / Use of SNMP exporter”)
Labels are also automatically added by netbox-prometheus-sd from the data retrieved from Netbox:
__meta_netbox_name: name of the device__meta_netbox_tenant: slug of the tenant to which the device belongs__meta_netbox_tenant_group: slug of the group to which the tenant of the device belongs__meta_netbox_cluster: name of the cluster to which the device belongs__meta_netbox_asset_tag: asset tag defined for the device__meta_netbox_role: slug of the role to which the device belongs__meta_netbox_type: type of model of the device__meta_netbox_rack: name of the rack in which the device is located__meta_netbox_pop: slug of the POP in which the device is located__meta_netbox_serial: serial number of the device__meta_netbox_parent: name of the parent of the device
These labels are prefixed by __meta_netbox and are automatically excluded from the metrics recorded by Prometheus, so you will have to use relabeling rules to keep them (see the “Prometheus configuration” section).
2. Launching netbox-prometheus-sd
This project being a simple Python script, it will be enough to copy it on the server hosting the Prometheus instance and then to launch it in a regular way, for example through a Crontab.
The command line to run is typically the following:
$ netbox-prometheus-sd.py https://nebox.your-company.com/ 'API_TOKEN' '/path/to/generated/output.json'
After running this command, you should be able to observe your targets in the generated JSON file.
Our monitoring infrastructure being containerized, we also provide a Dockerfile in the Git project repository. You will have to take care to share a volume between the Prometheus container and the netbox-prometheus-sd container so that it can access the JSON file generated by the latter.
3. Prometheus configuration
Finally, you will have to configure a job in the prometheus.yaml file so that Prometheus can learn its targets from the JSON file generated by netbox-prometheus-sd through the file service discovery :
- job_name: 'netbox'
  file_sd_configs:
    - files:
      - '/path/to/generated/output.json'
      relabel_configs:
      - regex: __meta_netbox_(.+)
        replacement: netbox_$1
        action: labelmap
The relabel_configs section allows renaming all labels defined by Netbox as __meta_netbox_foo to the form foo. This will allow saving of the information from Netbox since Prometheus gets rid of all labels starting with __ before saving a metric.
Restart Prometheus and you should see your targets appear in the Status -> Targets page of the Prometheus administration page.
Special cases
Using the exporter_exporter
The exporter_exporter is a very lightweight reverse proxy designed to aggregate multiple exporters listening on different ports. These exporters are then accessible by selecting them via the HTTP module parameter.
With a configuration of the exporter_exporter similar to this:
modules:
  node:
    method: http
    http:
       port: 9100

  cadvisor:
    verify: false
    method: http
    http:
       port: 4194
You will have to attach the following JSON configuration to your device in Netbox so that each of the exporters is interrogated:
[{"__param_module": "node"}, {"__param_module": "cadvisor"}]
Using the snmp_exporter
The snmp_exporter is an interesting case because it illustrates the problem that can arise when a Prometheus exporter is not running directly on the device to be interrogated. The operation is similar to a proxy server: we talk to the exporter by providing the real address of the device to be interrogated in SNMP.
The snmp_exporter also integrates a module concept which allows to indicate the different parameters to be used to poll a device (community, OIDs to poll etc).
When Prometheus scrapes the snmp_exporter, it must provide the address of the real target and the module to use. For this we will introduce a label “__snmp_module___” which will contain the name of the module to use. Moreover, when defined, this label will allow to distinguish the targets to be interrogated via the exporter_snmp from those to be directly interrogated. The address of the SNMP target will be retrieved from the __adress__ label during the relabeling.
Let’s modify the Prometheus jobs configuration as follows:
- job_name: 'netbox'
  file_sd_configs:
    - files:
      - '/path/to/generated/output.json'
      relabel_configs:
      - regex: __meta_netbox_(.+)
        replacement: netbox_$1
        action: labelmap
      - source_labels: [__snmp_module__]
        regex: .+
        action: drop

- job_name: 'netbox_snmp'
  file_sd_configs:
    - files:
      - '/path/to/generated/output.json'
      relabel_configs:
      - regex: __meta_netbox_(.+)
        replacement: netbox_$1
        action: labelmap
      - source_labels: [__snmp_module__]
        regex: .+
        action: keep
      - source_labels: [__address__]
        target_label: __param_target
      - source_labels: [__param_target]
        target_label: instance
      - target_label: __address__
        replacement: snmp-exporter:9116
The prom_labels field of our device would be configured as follows:
{"__snmp_module__": "arista_sw"}
Please note: the arista_sw module is defined in the snmp_exporter default configuration
Once the target is generated, it should look like this in Prometheus:
- Target:
http://snmp-exporter:9116/proxy __param_target:11.22.33.44(primary_ip of the device)instance:11.22.33.44__snmp_module__:arista_sw- […]
To conclude
So there you are, we have succeeded to connect the Prometheus Service Discovery to Netbox : your Prometheus is now able to automatically discover its targets to be monitored.
We do hope this project will save you some time. Don’t hesitate to share your feedback and to contribute to the project on Github !
Do not miss our latest DevOps and Cloud Native blogposts! Follow Enix on Linkedin!